Searistica:
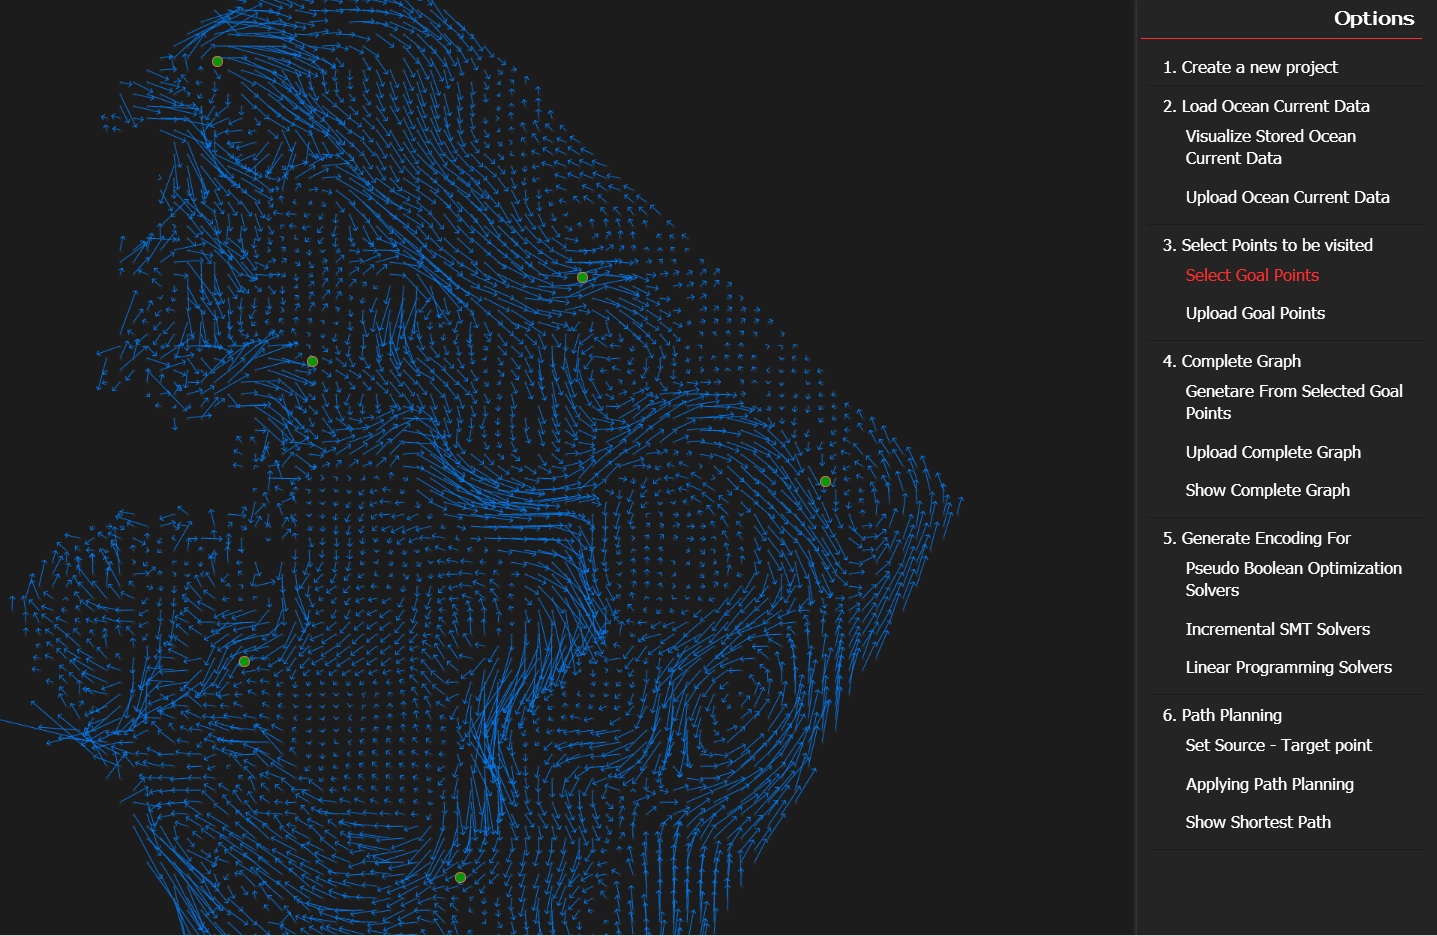
Autonomous underwater vehicles (AUVs), in particular gliders, have been used for many tasks such as underwater surveys. Modern-day gliders can perform month-long missions. During a mission, several factors impact their performance: ocean currents, lack of communication and GPS while under water, weather. At present engineers do not seem to do much mission planning, supplying a glider with a list of goals created by hand. Developing tools for planning such missions is the goal of this project.
At the heart of such mission planning problem are variants of the Asymmetric Traveling Salesman problem: as it is NP-hard, there is no known algorithm to solve it exactly in polynomial time. However, over the last decade heuristic solvers, in particular solvers based on Integer Linear Programming and Satisfiability, have been used successfully in practice to solve industrial instances of many NP-hard problems.
In this project we will describe a glider mission planner that we developed, which is based on using such solvers. We evaluate performance of generic solvers, in particular we used a Mixed Integer Linear Programming (MILP) solver CPLEX, several Pseudo-Boolean Optimization (PBO) solvers Sat4j, Clasp, SCIP and Satisfiability Modulo Theories (SMT) solver Z3 as the core engine of our planner. The performance of finding a optimal mission plan also heavily depends on the type of encodings. In addition to different solvers, we analyzed several types of encodings, from the classic Miller, Tucker and Zemlin encoding to Fox, Gavish and Graves time-dependent TSP encoding.
In our experiments, Mixed Integer Linear Programming solver (CPLEX) has been the most successful in comparison to PBO and SMT solvers.
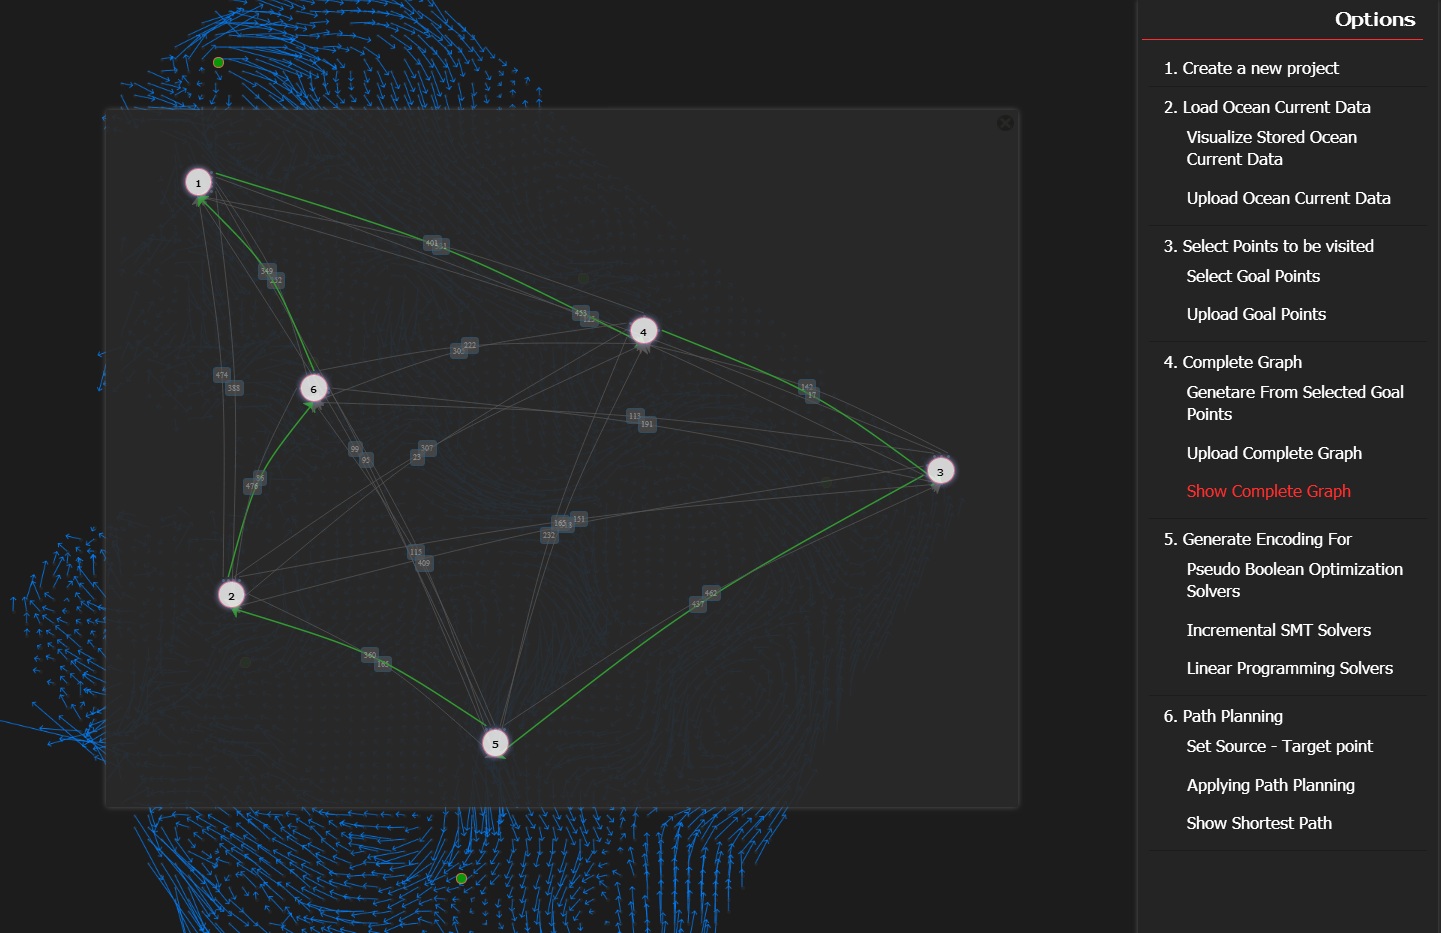
Complete graph generated from selected goal locations.
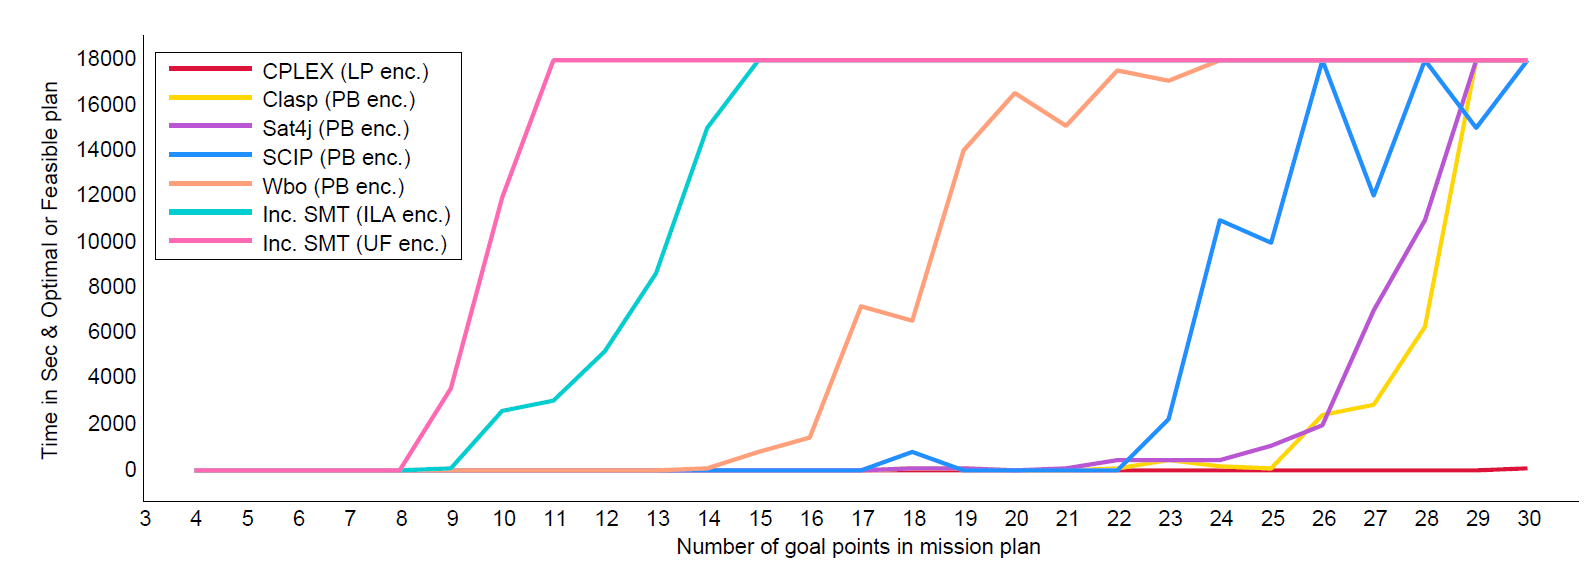
Comparison of running time on different solvers.
Download
You can download the project folder which contains both web application and encoding generator source codes. Download
Installation instructions for Searistica glider mission planner.
This software has been developed using microsoft Asp.net and SQL server. To run this software, you need to have installed the MS Visual Studio (2008 or later) for web application development. We also assume that you have Python installed. Make sure you always run or install every program as a windows administator.
-
-
Step 1: SQL server configuration.
- To run the web app you have to install the SQL server (2008 or later).
- After installing SQL server create a database from 'DataBase/byteknight.mdf'. This will create a local database schema to store the ocean current data. (you can import any .mdf file from SQL server to create the a database.)
-
-
Step 2: Web server and starting the app.
- As this is a web application, you will need a web server running. You can install IIS , if your machine doesn't have IIS installed.
- Open the project from visual studio (open NewByteKnight.sln from project folder). Now you can run the web application.
- This web app uses WCF (Web service), so if there is any error related this, then you may have to give permission. See here .
- If web application loads successfully then it's ready to use.
-
-
Step 3: Preparing the data.
- Usually you can load your ocean data (we assume data would be in format of u and v component and with a location point start from 0,0) and visualize them on this interface.
- To process your own ocean data you can see the code in 'Business\DFOdata\DFOdataProcessor.cs'- it will get generate an average ocean current data of given cell radius.
-
-
Step 4: Using the mission planner.
- Select points from the web interface. They will be stored in the file "selectedPoints.txt".
- You can use your own path planner, or our basic path planner (provided) in order to calculate pairwise distances between selected points. This path planner requires the data to be in grid format; our preprocessor "Business\DFOdata\DFOdataProcessor.cs" takes one layer of the data in Drog3D format, converts it into a grid representation and computes pairwise distances on that grid using Dijkstra's algorithm implementation 'PathPlanner\newpathplanning.py`. When points are selected, their pairwise distances are extracted from the resulting file 'distances.txt'.
- If you use your own path planner, note that the points generated by the web app use shifted coordinates with the top right corner set to (0,0).
- Our path planner places the generated pairwise cost matrix in a file with the name "x_nodes", where "x" is the number of points selected, in the folder "Benchmarks".
-
-
Step 5: Invoking solvers.
- We assume that you have installed solvers (for example, CPLEX on your system).
- There is a number of python scripts generating a variety of encodings for different solvers in the EncodingGen folder. You can generate encodings for PBO, LP and SMT solvers, in corresponding formats. We recommended to use CPLEX (or other mixed integer linear programming solver using the same input format) and Desroches-Laporte encoding: use 'EncodingGen\Desrochers_Laporte_DL\cplexEncoding\mipEncodingGenerator.py' to generate LP encoding from a given cost matrix file. This script assumes the cost matrix file resides in 'Benchmarks' folder.
- Depending on the power of your system and location of your solvers, you might prefer to copy the encoding and run the solvers on a high performance server, especially if you have a large number of points. Once the solver perform it's computation it stores the result on this folder 'SolverResult_for_BenchMarks\cplexMipResult\4_Nodes\baseTest_set\dlEncoding'. Now copy the result file and put it in the project root directory with a name solver-result.lp .
- You can now visualize the final tour in the web application.