
Portfolio Details
Project Information
- Category: Data Analysis, Data Visualization, Graphic design
- Tools: Python, Pandas, Jupyter Notebook, Voila, Canva
- Project date: May 2024
Rec center Interacive Dash
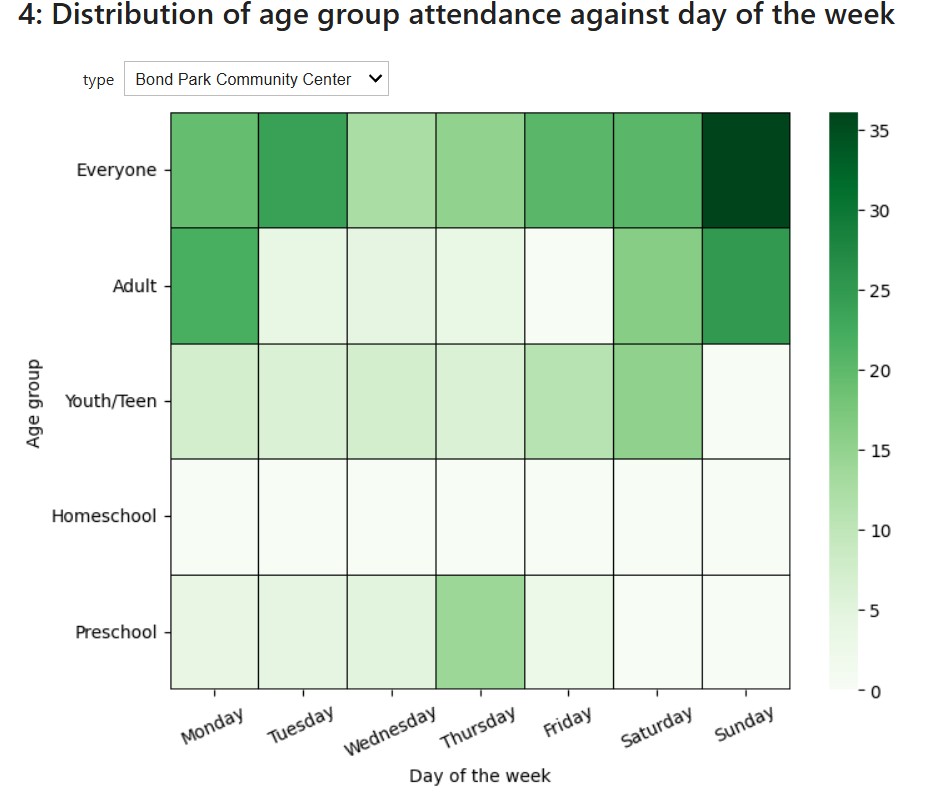
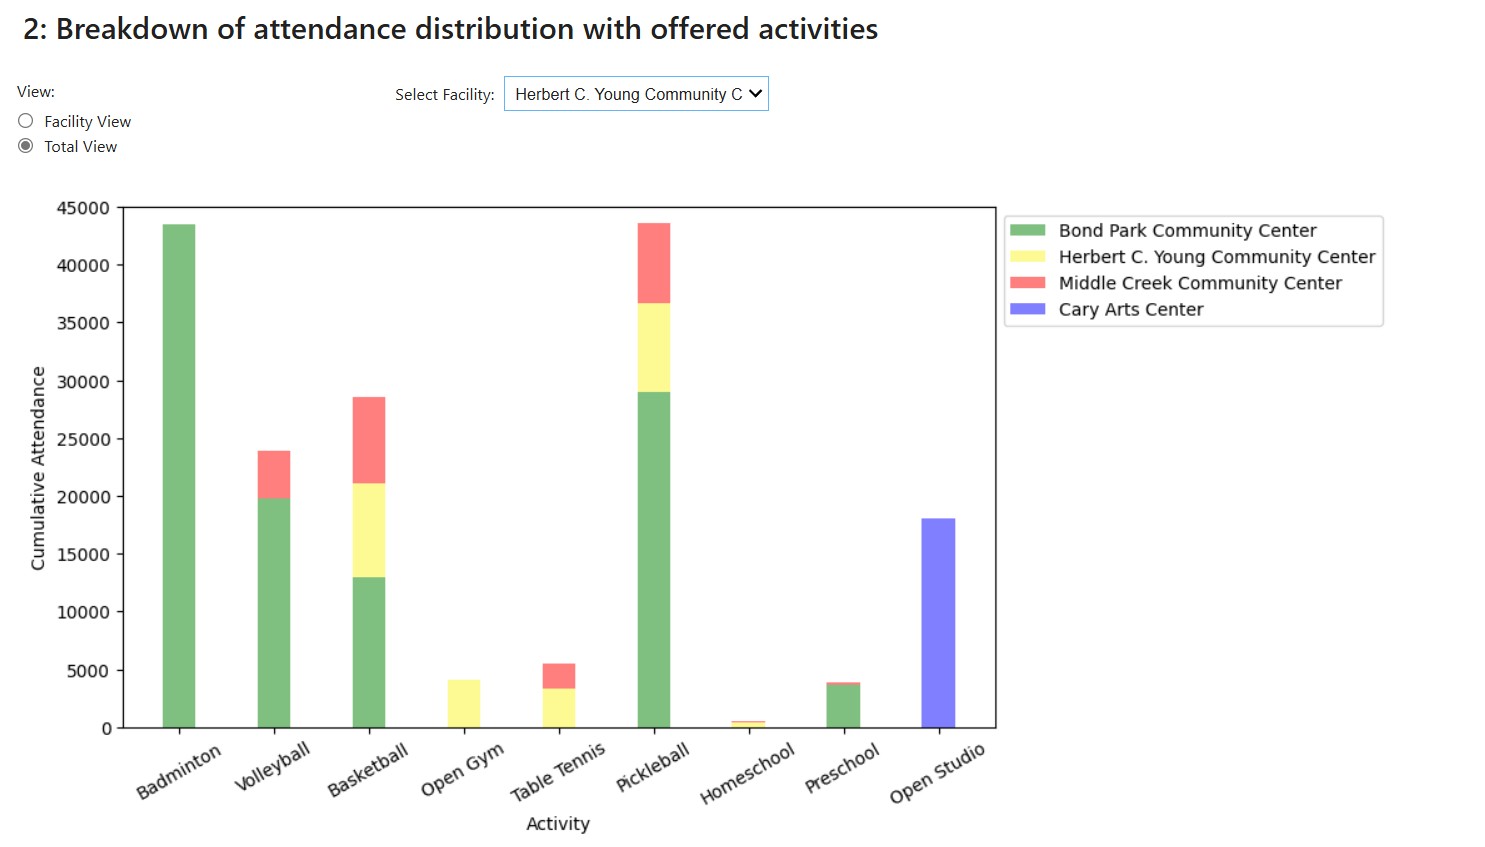
In fulfillment of the requirements of COMP 4304, an Interactive dashboard analyzing trends in attendance for 4 community centers in the city. The full project can be found on my github.
With 4 total visualizations and 8 customization options, the dashboard allows the user full control over which parts of the information they'd like to look at. The logo design was done on Canva.
This project was nominated for the Pro Vice-Chancellor's Award for Academix Excellence in a Final Project by Dr. Terrence Tricco.